 Web Server Statistics for murphyandfay.com
Program started on Fri, Aug 29 2014 at 5:15 AM.
Analyzed requests from Wed, Jun 18 2014 at 2:08 AM to Thu, Aug 28 2014 at 7:37 AM (71.23 days).
Web Server Statistics for murphyandfay.comProgram started on Fri, Aug 29 2014 at 5:15 AM.
Analyzed requests from Wed, Jun 18 2014 at 2:08 AM to Thu, Aug 28 2014 at 7:37 AM (71.23 days).
(Go To: Top | General Summary | Monthly Report | Daily Summary | Hourly Summary | Domain Report | Organization Report | Failed Referrer Report | Browser Report | Browser Summary | Operating System Report | Status Code Report | File Size Report | File Type Report | Directory Report | Request Report)
Figures in parentheses refer to the 7-day period ending Aug 29 2014 at 5:15 AM.
Successful requests: 74 (5)
Average successful requests per day: 1 (0)
Successful requests for pages: 39 (2)
Failed requests: 96 (1)
Redirected requests: 18 (0)
Distinct files requested: 26 (0)
Distinct hosts served: 30 (0)
Data transferred: 1.62 megabytes (196.79 kilobytes)
Average data transferred per day: 23.23 kilobytes (28.11 kilobytes)
(Go To: Top | General Summary | Monthly Report | Daily Summary | Hourly Summary | Domain Report | Organization Report | Failed Referrer Report | Browser Report | Browser Summary | Operating System Report | Status Code Report | File Size Report | File Type Report | Directory Report | Request Report)
Each unit ( ) represents 1 request for a page.
| month | #reqs | #pages | |
|---|---|---|---|
| Jun 2014 | 28 | 7 |   |
| Jul 2014 | 28 | 19 |  |
| Aug 2014 | 18 | 13 |  |
Busiest month: Jul 2014 (19 requests for pages).
(Go To: Top | General Summary | Monthly Report | Daily Summary | Hourly Summary | Domain Report | Organization Report | Failed Referrer Report | Browser Report | Browser Summary | Operating System Report | Status Code Report | File Size Report | File Type Report | Directory Report | Request Report)
Each unit () represents 1 request for a page.
| day | #reqs | #pages | |
|---|---|---|---|
| Sun | 8 | 7 | |
| Mon | 6 | 4 | |
| Tue | 3 | 2 | |
| Wed | 26 | 12 | |
| Thu | 15 | 5 | |
| Fri | 8 | 4 | |
| Sat | 8 | 5 | |
(Go To: Top | General Summary | Monthly Report | Daily Summary | Hourly Summary | Domain Report | Organization Report | Failed Referrer Report | Browser Report | Browser Summary | Operating System Report | Status Code Report | File Size Report | File Type Report | Directory Report | Request Report)
Each unit () represents 1 request for a page.
| hour | #reqs | #pages | |
|---|---|---|---|
| 0 | 1 | 1 | |
| 1 | 1 | 1 | |
| 2 | 7 | 7 | |
| 3 | 2 | 1 | |
| 4 | 2 | 2 | |
| 5 | 1 | 0 | |
| 6 | 6 | 2 | |
| 7 | 2 | 0 | |
| 8 | 0 | 0 | |
| 9 | 3 | 1 | |
| 10 | 8 | 2 | |
| 11 | 2 | 0 | |
| 12 | 13 | 3 | |
| 13 | 1 | 0 | |
| 14 | 1 | 1 | |
| 15 | 2 | 2 | |
| 16 | 1 | 1 | |
| 17 | 2 | 2 | |
| 18 | 3 | 1 | |
| 19 | 2 | 1 | |
| 20 | 3 | 2 | |
| 21 | 2 | 1 | |
| 22 | 3 | 3 | |
| 23 | 6 | 5 | |
(Go To: Top | General Summary | Monthly Report | Daily Summary | Hourly Summary | Domain Report | Organization Report | Failed Referrer Report | Browser Report | Browser Summary | Operating System Report | Status Code Report | File Size Report | File Type Report | Directory Report | Request Report)
Listing domains, sorted by the amount of traffic.
| #reqs | %bytes | domain |
|---|---|---|
| 74 | 100% | [unresolved numerical addresses] |
(Go To: Top | General Summary | Monthly Report | Daily Summary | Hourly Summary | Domain Report | Organization Report | Failed Referrer Report | Browser Report | Browser Summary | Operating System Report | Status Code Report | File Size Report | File Type Report | Directory Report | Request Report)

Listing organizations, sorted by the number of requests.
| #reqs | %bytes | organization |
|---|---|---|
| 31 | 5.57% | 23 |
| 6 | 16.21% | 71 |
| 6 | 13.33% | 198.199 |
| 5 | 14.64% | 198.20 |
| 5 | 9.23% | 192.34 |
| 4 | 7.55% | 198.211 |
| 3 | 5.80% | 104 |
| 3 | 1.58% | 107 |
| 3 | 8.80% | 141.212 |
| 2 | 5.80% | 66.240 |
| 1 | 192.241 | |
| 1 | 2.90% | 125 |
| 1 | 2.78% | 162.243 |
| 1 | 2.90% | 193.174 |
| 1 | 2.90% | 82 |
| 1 | 64.202 |
(Go To: Top | General Summary | Monthly Report | Daily Summary | Hourly Summary | Domain Report | Organization Report | Failed Referrer Report | Browser Report | Browser Summary | Operating System Report | Status Code Report | File Size Report | File Type Report | Directory Report | Request Report)
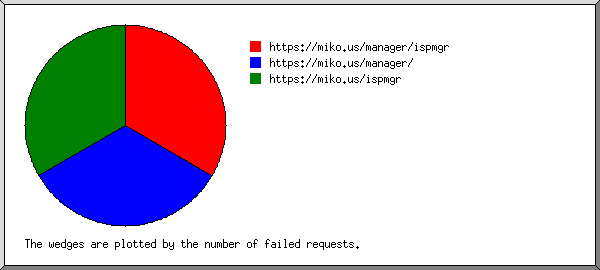
Listing referring URLs, sorted by the number of failed requests.
| #reqs | URL |
|---|---|
| 3 | https://miko.us/manager/ispmgr |
| 3 | https://miko.us/manager/ |
| 3 | https://miko.us/ispmgr |
(Go To: Top | General Summary | Monthly Report | Daily Summary | Hourly Summary | Domain Report | Organization Report | Failed Referrer Report | Browser Report | Browser Summary | Operating System Report | Status Code Report | File Size Report | File Type Report | Directory Report | Request Report)
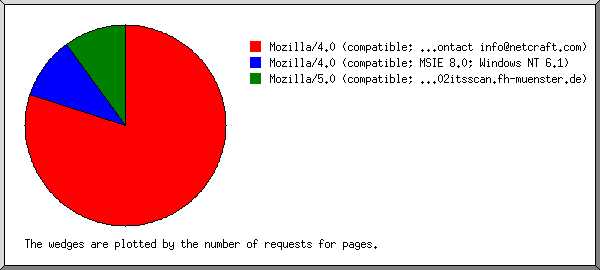
Listing browsers with at least 1 request for a page, sorted by the number of requests for pages.
| #reqs | #pages | browser |
|---|---|---|
| 7 | 7 | Mozilla/4.0 (compatible; MSIE 6.0; Windows NT 5.1; Netcraft SSL Server Survey - contact info@netcraft.com) |
| 1 | 1 | Mozilla/4.0 (compatible; MSIE 8.0; Windows NT 6.1) |
| 1 | 1 | Mozilla/5.0 (compatible; Muenster University of Applied Sciences; +http://fb02itsscan.fh-muenster.de) |
| 29 | 0 | [not listed: 13 browsers] |
(Go To: Top | General Summary | Monthly Report | Daily Summary | Hourly Summary | Domain Report | Organization Report | Failed Referrer Report | Browser Report | Browser Summary | Operating System Report | Status Code Report | File Size Report | File Type Report | Directory Report | Request Report)
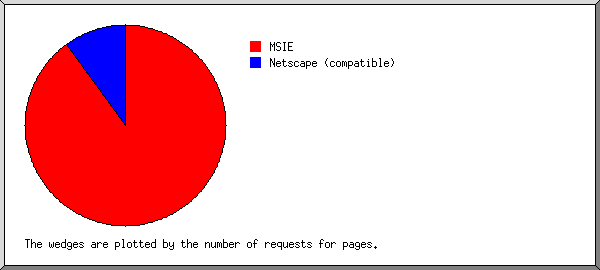
Listing browsers with at least 1 request for a page, sorted by the number of requests for pages.
| # | #reqs | #pages | browser |
|---|---|---|---|
| 1 | 8 | 8 | MSIE |
| 7 | 7 | MSIE/6 | |
| 1 | 1 | MSIE/8 | |
| 2 | 1 | 1 | Netscape (compatible) |
| 29 | 0 | [not listed: 1 browser] |
(Go To: Top | General Summary | Monthly Report | Daily Summary | Hourly Summary | Domain Report | Organization Report | Failed Referrer Report | Browser Report | Browser Summary | Operating System Report | Status Code Report | File Size Report | File Type Report | Directory Report | Request Report)

Listing operating systems, sorted by the number of requests for pages.
| # | #reqs | #pages | OS |
|---|---|---|---|
| 1 | 8 | 8 | Windows |
| 7 | 7 | Windows XP | |
| 1 | 1 | Unknown Windows | |
| 2 | 30 | 1 | OS unknown |
(Go To: Top | General Summary | Monthly Report | Daily Summary | Hourly Summary | Domain Report | Organization Report | Failed Referrer Report | Browser Report | Browser Summary | Operating System Report | Status Code Report | File Size Report | File Type Report | Directory Report | Request Report)
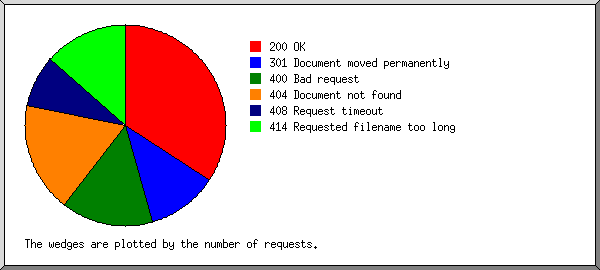
Listing status codes, sorted numerically.
| #reqs | status code |
|---|---|
| 74 | 200 OK |
| 18 | 301 Document moved permanently |
| 25 | 400 Bad request |
| 40 | 404 Document not found |
| 19 | 408 Request timeout |
| 12 | 414 Requested filename too long |
(Go To: Top | General Summary | Monthly Report | Daily Summary | Hourly Summary | Domain Report | Organization Report | Failed Referrer Report | Browser Report | Browser Summary | Operating System Report | Status Code Report | File Size Report | File Type Report | Directory Report | Request Report)
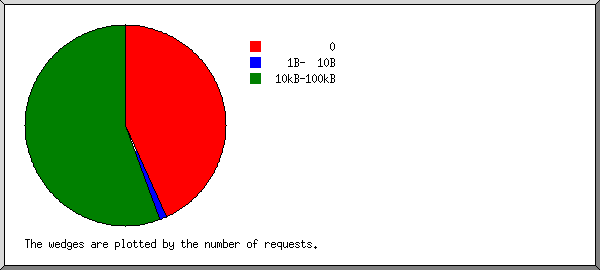
| size | #reqs | %bytes |
|---|---|---|
| 0 | 33 | |
| 1B- 10B | 1 | |
| 11B- 100B | 0 | |
| 101B- 1kB | 0 | |
| 1kB- 10kB | 0 | |
| 10kB-100kB | 40 | 100% |
(Go To: Top | General Summary | Monthly Report | Daily Summary | Hourly Summary | Domain Report | Organization Report | Failed Referrer Report | Browser Report | Browser Summary | Operating System Report | Status Code Report | File Size Report | File Type Report | Directory Report | Request Report)

Listing extensions with at least 0.1% of the traffic, sorted by the amount of traffic.
| #reqs | %bytes | extension |
|---|---|---|
| 39 | 83.06% | [directories] |
| 6 | 16.94% | [no extension] |
| 29 | [not listed: 1 extension] |
(Go To: Top | General Summary | Monthly Report | Daily Summary | Hourly Summary | Domain Report | Organization Report | Failed Referrer Report | Browser Report | Browser Summary | Operating System Report | Status Code Report | File Size Report | File Type Report | Directory Report | Request Report)

Listing directories with at least 0.01% of the traffic, sorted by the amount of traffic.
| #reqs | %bytes | directory |
|---|---|---|
| 67 | 83.06% | [root directory] |
| 6 | 16.94% | [no directory] |
| 1 | [not listed: 1 directory] |
(Go To: Top | General Summary | Monthly Report | Daily Summary | Hourly Summary | Domain Report | Organization Report | Failed Referrer Report | Browser Report | Browser Summary | Operating System Report | Status Code Report | File Size Report | File Type Report | Directory Report | Request Report)
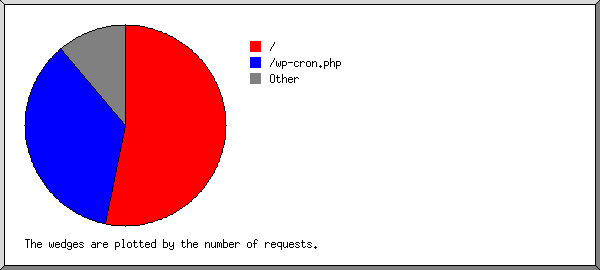
Listing files with at least 20 requests, sorted by the number of requests.
| #reqs | %bytes | last time | file |
|---|---|---|---|
| 39 | 83.06% | Aug/27/14 11:06 PM | / |
| 28 | Aug/27/14 11:53 AM | /wp-cron.php | |
| 7 | 16.94% | Aug/27/14 11:07 PM | [not listed: 2 files] |